Engula Bench - Baseline Performance Comparison Tool
Document Version: v2.1 Last Updated: 2025-09-19 Maintained by: Engula Team
Design Goals and Comparison Methodology
Goals
Compare the Get/Set throughput and latency performance of Engula 2.1 versus Redis 7.2 across different value sizes and CPU core configurations.
Metrics
- QPS (Throughput): Queries per second
- P50 (Average Latency): Median response time
Comparison Methodology
- Single-instance comparison with persistence disabled, focusing on in-memory path and protocol processing performance
- I/O thread dimension: io-threads ∈ {1, 2, 4}
- Fixed data scale, request distribution, and concurrency model for reproducible results
- Multiple value size coverage: 8B, 32B, 128B, 512B, 1KB, 2KB
Product Overview
Comparison Test Workflow
- Start services (specify io-threads and CPU affinity)
- Run formal stress tests (repeat 3 times and take the average)
- Record QPS and P50, and save raw logs
Test Data Cases
- Total keys: 1,000,000
- Value size ranges: 8B, 32B, 128B, 512B, 1KB, 2KB (test each range and produce results)
Comparison Test Command Examples
For a test scenario with the server CPU resources limited to 2 vCores and value size of 128B, the test commands are:
For other test scenarios, replace the CPU resource and value size parameters accordingly.
Usage Instructions
For convenience, Engula Bench provides a Docker-based usage mode.
Runtime Environment
Engula Bench is provided as a Docker image and can run on Linux or macOS systems with Docker installed. Environment requirements:
- CentOS: Version ≥ 7.9
- Ubuntu: Version ≥ 18.04
- Docker: Recommended to use official Docker version (installation guide, VPN may be required in some networks)
- CPU: Recommended host CPU cores ≥ 8
- Glibc: Version ≥ 2.34
Running Engula Bench
The running result will display as shown below:
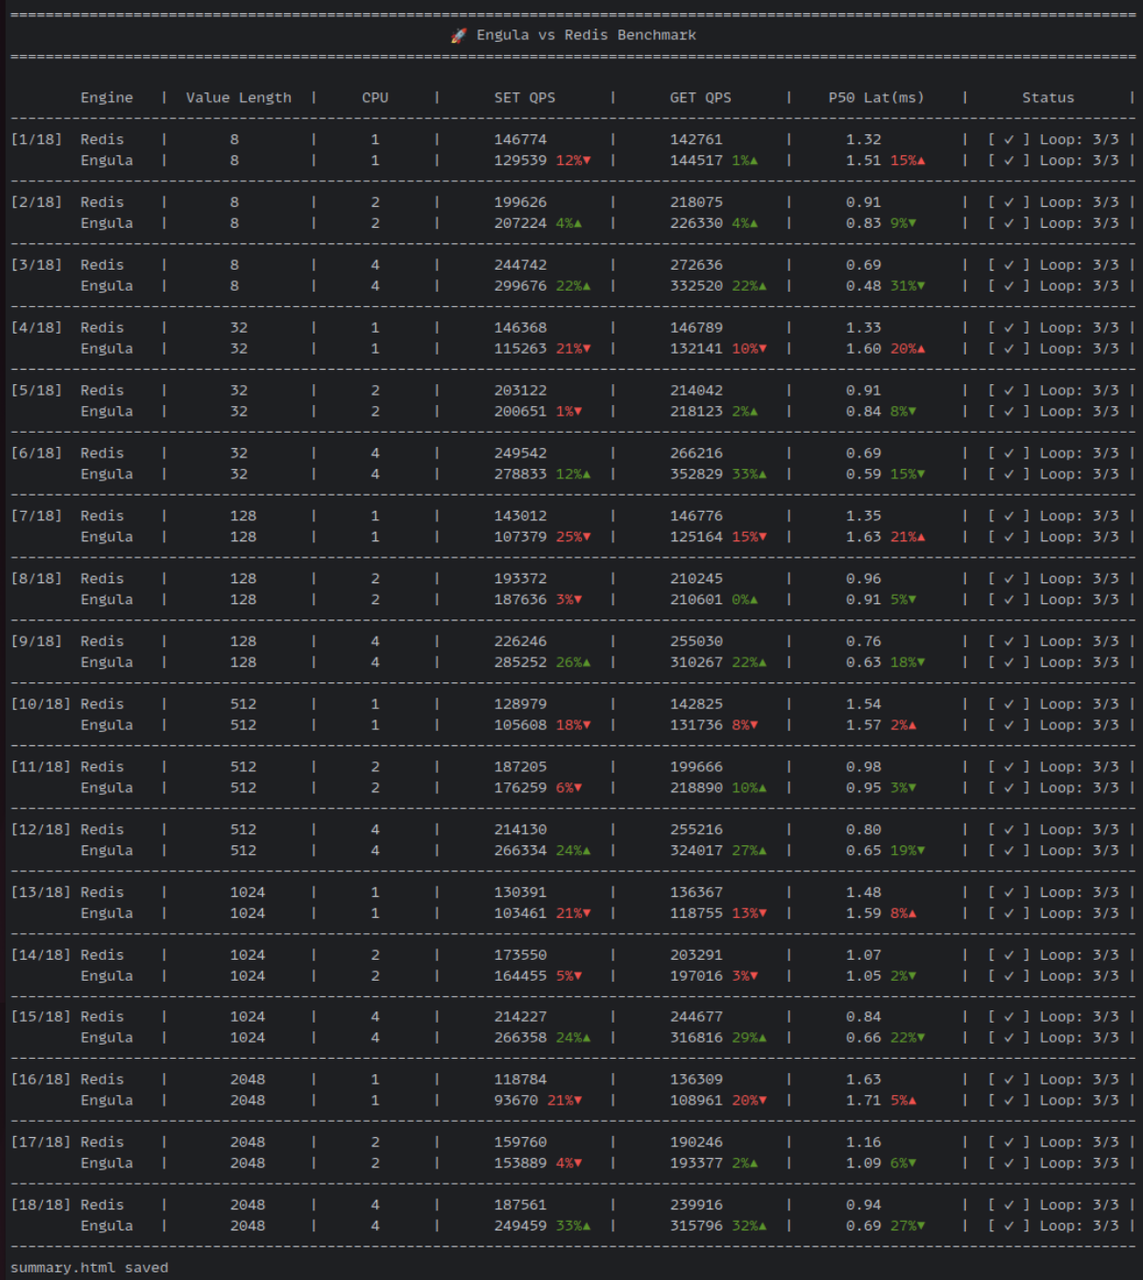
Since there are a total of 18 comparison groups, with Redis and Engula tested serially in each group, and each group tested 3 times, the entire test takes approximately 40 minutes to complete.
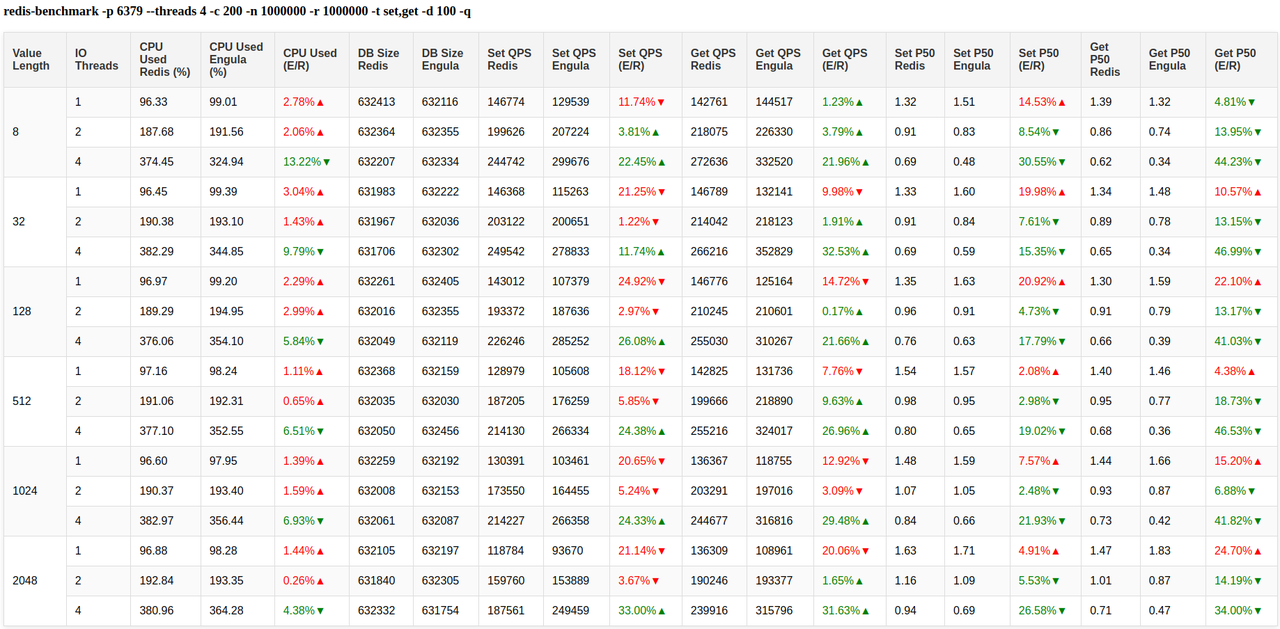
Viewing Results
After execution, a summary.html file will be generated. Open it in a browser to view the results:
FAQ
My environment doesn't support Docker. Is there a binary test method?
Yes. Contact the Engula team to obtain the installation package. Please provide the following information about your test machine:
- Operating system version
- CPU architecture
- Other relevant system information
After obtaining the installation package, test using the following method:
The execution process is consistent with section 3.2 above.
The performance test tool displays scrolling output
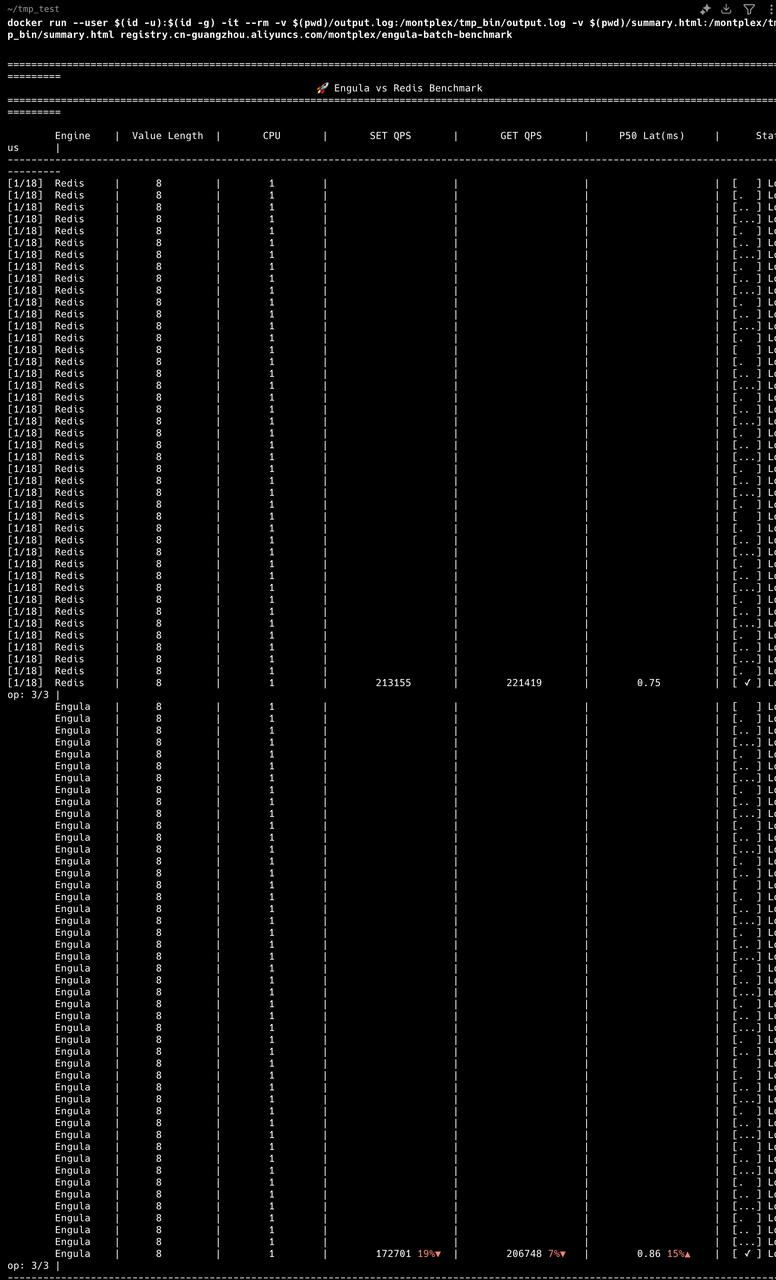
This scrolling phenomenon occurs when the total width of the output content exceeds the terminal window width. The text automatically wraps to new lines. The \r carriage return can only return to the beginning of the current line, but if the content spans multiple lines, it cannot correctly overwrite the previous output, causing continuous new lines.
Solution: Reduce the terminal font size and increase the terminal width.